Library specificity fails its frozen test
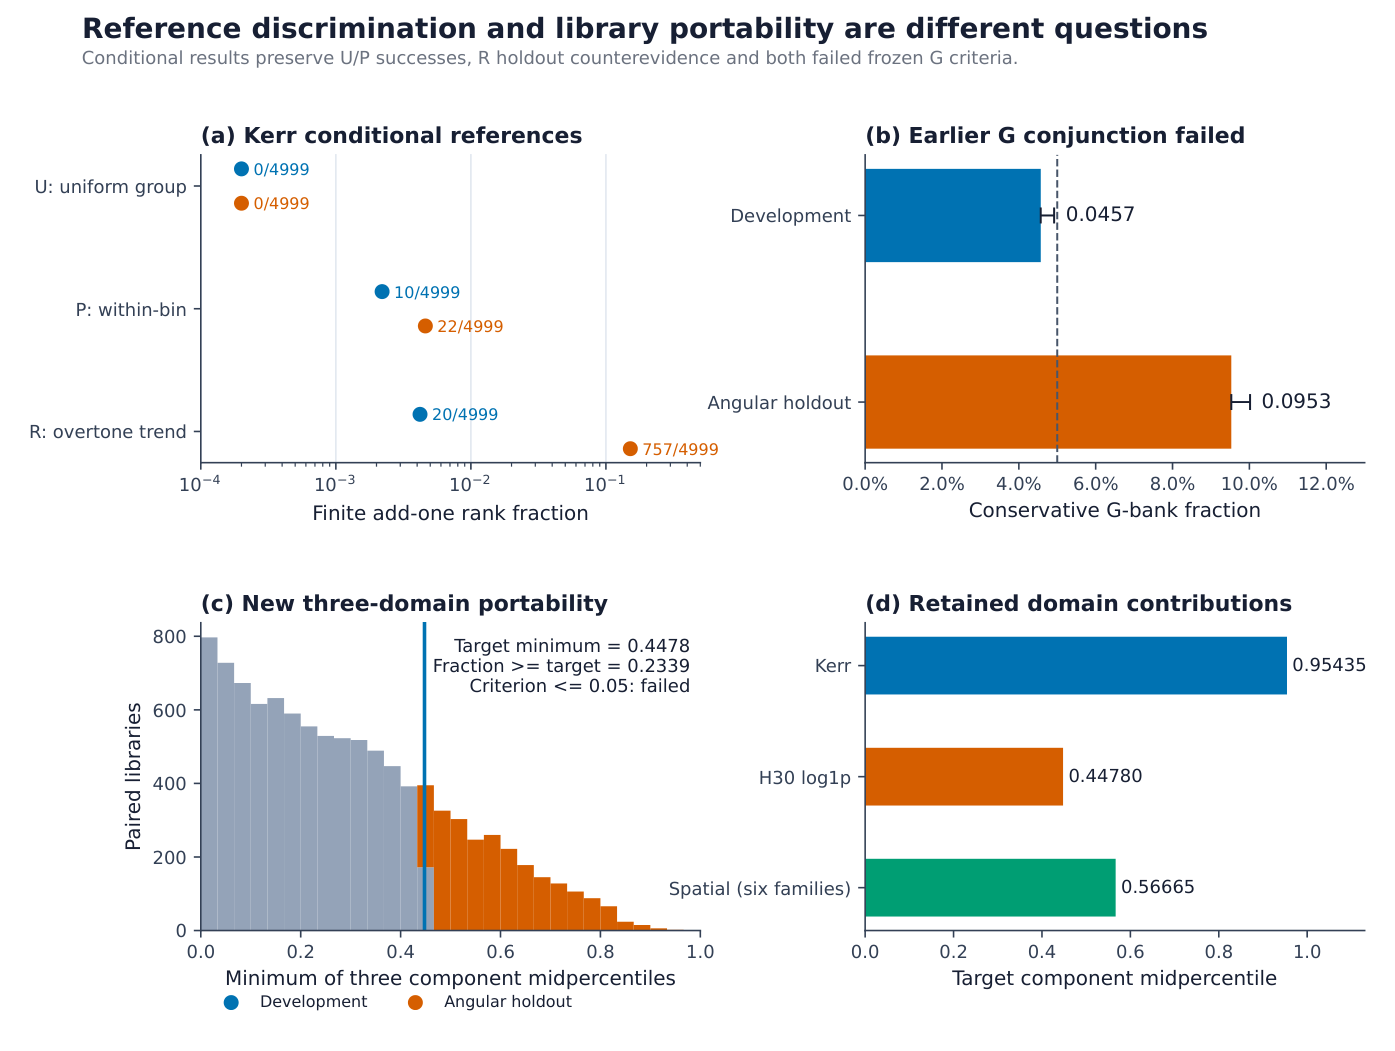
The target midpositions are , and . Their minimum is . In the target-plus- population, 23.39% reach or exceed this minimum. That is above the frozen criterion. The original fifteen centers do not demonstrate an unusual simultaneous advantage across all three native domains.
The earlier Kerr-only test also misses its frozen conjunction. The ranks were 457/10,000 in development and 953/10,000 on angular holdout, with add-one fractions 0.0457 and 0.0953. One-sided 95% upper bounds were approximately 0.04919 and 0.10018. Both had to meet the 5% criterion. The target still exceeds the means by 0.03141 and 0.03323 incidence units respectively. Higher absolute incidence on holdout does not rescue the rank prediction. The secondary ranks, 135 and 743, also miss top-5% holdout performance.
The failed tests limit a library advantage. They do not negate the measured recurrence or the U/P discrimination. Conversely, those positive results do not establish a universal replacement. The alternative library was mechanically matched in Kerr, and its density-weighted effects on another operator remain empirical comparisons rather than a derived coordinate mapping.
Which spectral theories could explain this profile?
Consecutive gaps are a complementary observable
For ordered levels , Atas et al. [1] use gaps , consecutive ratios , and folded ratios . A gap ratio uses three adjacent levels. With 464 distinct levels it yields 462 overlapping observations, instead of the 214,832 ordered value ratios here. Positive affine changes leave the gap ratios unchanged. All-pair value ratios are scale-invariant and generally shift-sensitive.
A common local spacing scale cancels, allowing useful comparisons without explicit unfolding. Arbitrary nonlinear transforms are not exactly invisible: this cancellation is local when the density or transformation changes slowly across neighboring gaps. Symmetry sectors, unresolved degeneracies, spectral edges and finite-size effects require separate treatment. Atas et al. resolve translation sectors in the Ising example. The mere real symmetry of a structured graph does not establish GOE statistics.
The Gaussian-ensemble three-level surmise is
A stationary Poisson level process gives . The GOE folded-mean surmise differs from the reported large-matrix numerical mean near 0.5307. The paper gives an exact limiting GUE comparison via the sine-kernel process and documents finite-size corrections. These are gap-ratio laws, not predictions for arbitrary all-pair value-ratio window masses. This investigation ran no gap-statistics experiment on the present spectra.
Global density and local universality can vary independently
Levi and Oz [2] study feature-feature sample covariance with columns of representing centered, normalized samples. Natural-image datasets show the bulk rank law , separate from leading outliers and small-eigenvalue tails. Their correlated Gaussian model takes a positive diagonal population covariance from the singular values of the Toeplitz construction . Its sample covariance is Wishart. Generalized Marchenko–Pastur theory models density conditional on the population covariance and aspect ratio .
Correlated and uncorrelated Gaussian samples can share GOE gap statistics while exhibiting different global densities. Appendix C of their paper shows that a deterministic population spectrum can reproduce broad scaling and miss local sample-covariance spacings. Appendix D finds scaling changes under augmentation while local gaps are comparatively stable. Appendix E separates eigenvector localization and alignment from density. Appendix F uses the model predictively for learning curves with bulk, sampling and basis assumptions.
The operators here are single-image distance-graph Laplacians, a radial coupling graph and a transformed damping spectrum. The graph identity is a Gram factorization, but incidence columns are constrained, sparse and dependent; weights encode declared structure; and . The factorization supplies neither independent Gaussian samples nor a Wishart asymptotic regime. A bulk covariance law also does not cover the entire retained positive spectrum or its nonlinear minimum-dependent readout automatically. Neither cited work validates a quantitative prediction for these profiles.
A density explanation needs independent window predictions
An independently specified smooth log-native density under an additional iid distinct-value approximation gives
For uncut positive values with density and CDF , this is equivalently
For fixed unfiltered , the iid expected hit count is . With random filtered exposure, Equation (16) gives a population conditional-pair probability or ratio of expected counts, not generally .
Constrained finite ensembles can have the same mean one-point counting density and different factorial two-point intensity . Exact expected nonself counts integrate . Even fixed- iid values give . Dropping the factor corresponds to Poisson-number or asymptotic factorization. Connected correlations, variation between realization densities and extrema constraints can matter. In particular, hydrogen's Equation (3) fixes and ; retain the anchor and its finite pair weights.
Global density is a candidate explanation once a model and quantitative window predictions are specified. Local gap correlations supply different information. Replaying the measured spectrum by the exact autocorrelation identity is not an independent prediction. Appendix C gives a closed-form illustration without claiming a fit or test on these spectra.
Published source: Cross-Domain Spectral Ratio Structure: Refined Recurrence, Robustness and Diagnostic Limits. Read the original PDF alongside the web treatment.