Native profile recurrence
The common shape and the embryo exception
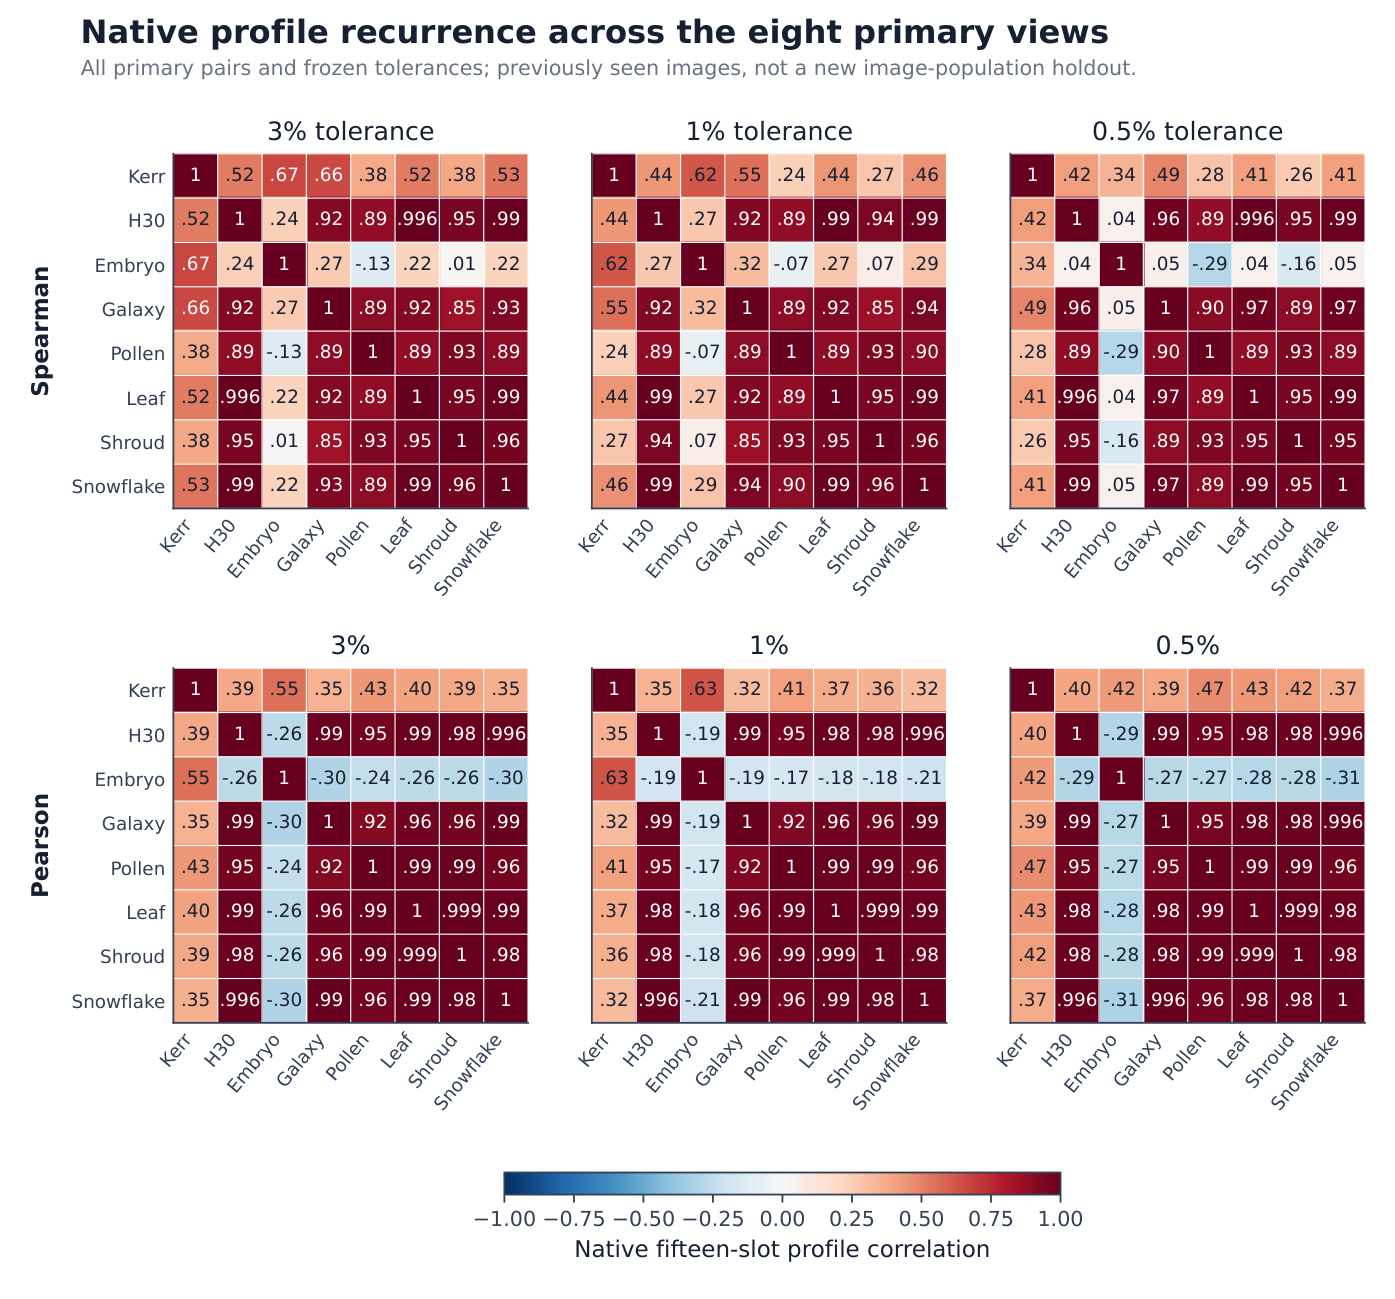
The observed comparison contains 17 views: Kerr, two hydrogen readouts and 14 spatial variants. The eight-view primary descriptive core contains Kerr, hydrogen log1p and six dark families. All identities, fifteen slots and three tolerances remain in the comparison. Figure 1 and Appendix D show every core pair, including image–image comparisons. The public supplement includes all 17 views.
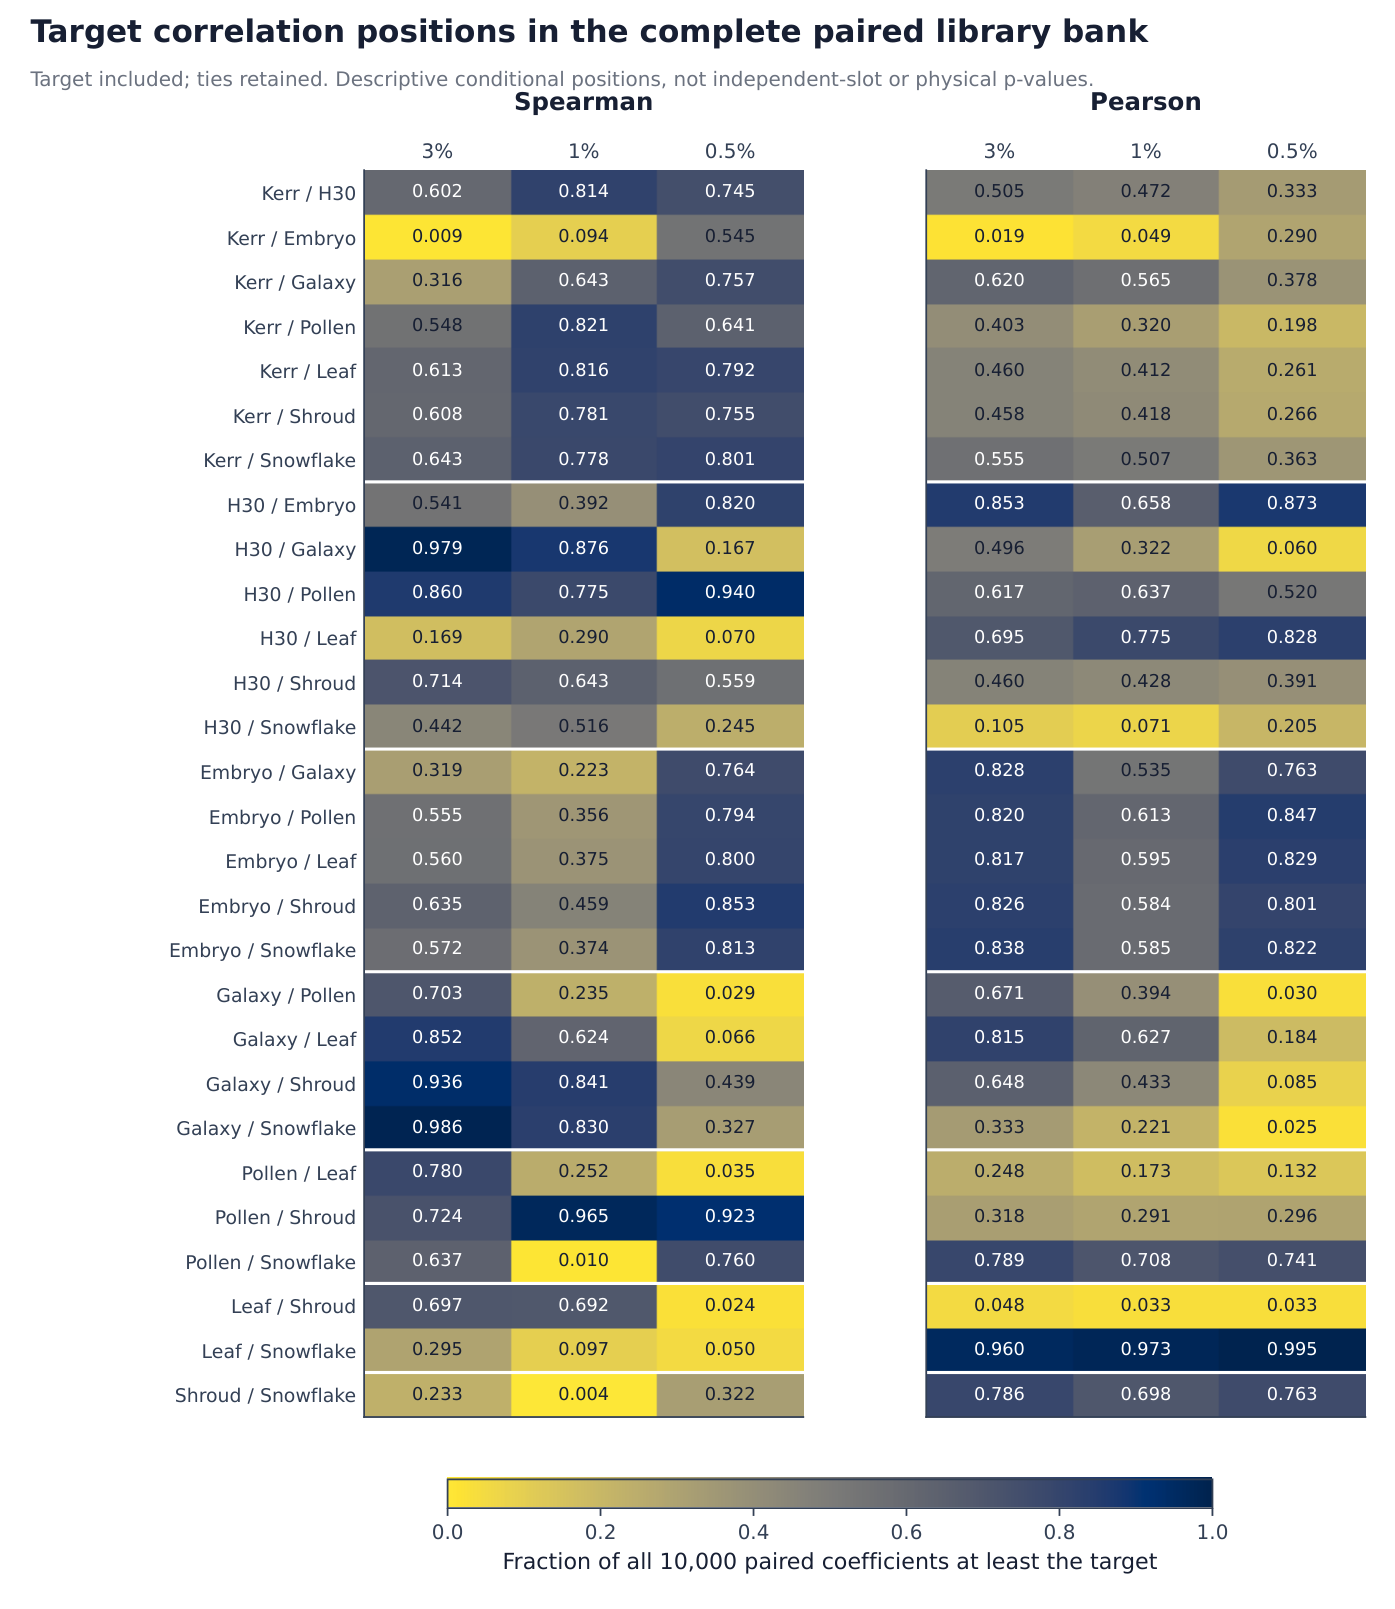
Table 2. Primary hydrogen log1p versus six dark image signatures. counts the fraction of all 10,000 paired-library coefficients at least the target, including target and ties.
| Source | Spearman 3% | Spearman 1% | Spearman 0.5% | Pearson 3% | 3% Spearman reference fraction |
|---|---|---|---|---|---|
| Embryo | 0.23900 | 0.26856 | 0.04482 | -0.25984 | 0.54060 |
| Galaxy | 0.92063 | 0.92328 | 0.96373 | 0.98928 | 0.97900 |
| Pollen-like | 0.88641 | 0.88641 | 0.88518 | 0.95464 | 0.86000 |
| Leaf | 0.99553 | 0.99463 | 0.99642 | 0.98673 | 0.16900 |
| Shroud | 0.94868 | 0.94492 | 0.94765 | 0.97981 | 0.71350 |
| Snowflake | 0.98743 | 0.98652 | 0.98921 | 0.99637 | 0.44180 |
At 3%, five hydrogen–image Spearman coefficients span 0.886 to 0.996. They remain between 0.885 and 0.996 at narrower widths. Embryo dark is the clear exception, at 0.239, 0.269 and 0.045, with negative Pearson coefficients at all widths. Its bright version differs strongly but remains a sensitivity view. Pairwise agreement among the five other primary images is also high: the 3% Spearman range is 0.851–0.988. The recurrence is broad and heterogeneous.
Kerr is more moderately related. Its 3% Spearman coefficients are 0.52143 with hydrogen, 0.66848 with embryo, 0.65708 with galaxy, 0.38277 with pollen-like microscopy, 0.52189 with leaf, 0.38399 with Shroud and 0.53335 with snowflake. The full comparisons retain each of these pairs and their narrower-width results.
Similar profiles also occur under alternative libraries
For hydrogen versus the six dark families, the 36 coefficient/tolerance comparisons give conservative fractions at least the target from 0.0598 to 0.9790. Strong recurrence in native profiles does not establish that the target library has an exceptional correlation in this bank.
Kerr–embryo at 3% is an exception to that general pattern. Its Spearman coefficient is 0.66848 with reference fraction 0.0086; Pearson is 0.54929 with fraction 0.0190. The distinction weakens at narrower widths. This is descriptive among the many retained pairs, not a replacement primary test. Both conservative fractions and symmetric midpositions are supplied because exact ties can be substantial. No new selected significance threshold is imposed.
Published source: Cross-Domain Spectral Ratio Structure: Refined Recurrence, Robustness and Diagnostic Limits. Read the original PDF alongside the web treatment.